How to display Statistics
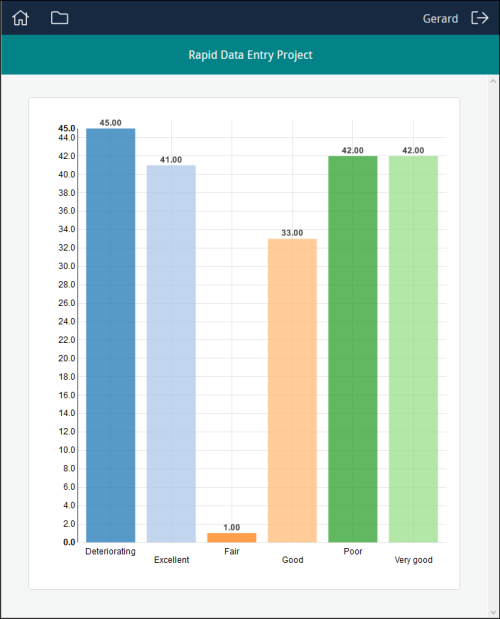
Authorized users (Managers) can be provided with graphs (bar and pie) presenting any sort of statistical data (the progress of a project, the condition of objects, etc.). A graph can be pointed at any column in any module, but some columns will be more useful to represent in a graph than others. This example graphically displays the condition of objects in the Catalogue:
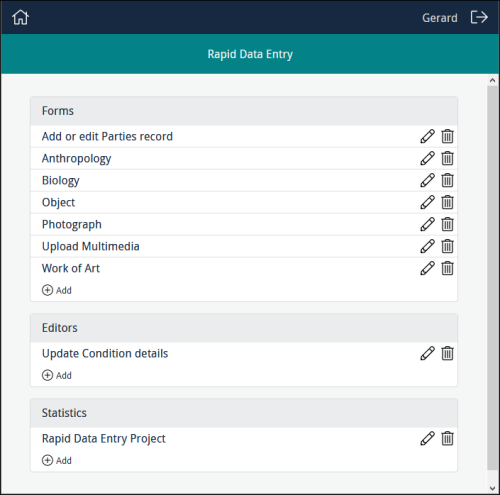
Available graphs (bar and pie) are listed under the Statistics heading:
- To create a new graph, click
 in the Statistics section.
 - Complete the top four fields:
Title
Give the graph a descriptive name.
This name will be listed in the Statistics section for authorized users.
Description
Add a description of the purpose of the graph. When users access the graph, an Information icon will display alongside the title. Clicking the icon will display a pop-up with details about the graph.
Identifier
In the Identifier field, add a descriptive identifier (or leave blank and an alphanumeric identifier will be assigned automatically).
Table
The module that holds the data that will be graphed.
- Specify permissions.
See How to specify permissions (How to specify permissions for project elements) for details.
- Complete the Statistic Designer fields:
Type
The type of graph:
- bar
- pie
Sort Column
The column holding the data to be graphed.
-
It is possible to filter values returned from Sort Column:
- Click
 .
. - Specify a Column and Value to filter results displayed in the graph.
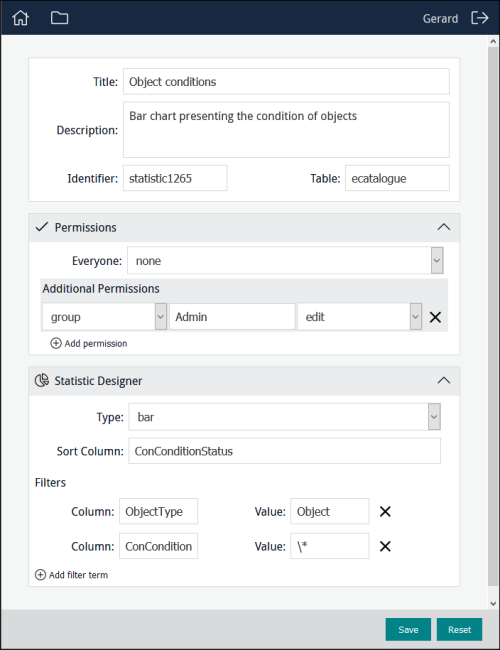
The graph shown above is configured as:
- Click
- Save the graph.


